Drivers of GHGE reductions in ‘Champion’ households
We identified 709 ‘Champion’ households, accounting for 3.3% of the total sample, who have substantially reduced their above-average GHGE footprints between January 2012 and December 2019. These households achieved a 34% reduction in GHGE, decreasing from a mean of 4.4 kg carbon dioxide equivalent (CO2e) per day in 2012–2014 to 2.9 kg CO2e per day in 2017–2019 per household member (Fig. 1). The average per capita GHGE footprint across the total sample remained relatively stable over the observation periods, at 3.4 kg CO2e per day, with only minor fluctuations (Supplementary Fig. 1).

Mean daily GHGE per capita (kg CO2e per day) for ‘Champion’ households during 2012–2014 and 2017–2019. Each bar represents cumulative emissions segmented by food group. Food groups are ranked vertically according to their contribution to total GHGE in the 2012–2014 period, from highest to lowest. Data source: Kantar Worldpanel Take Home data (52 w/e Dec. 2012–2019), GHGE factors from Clark et al.25.
The reduction in GHGE from ‘Champion’ households was driven by shifts in purchasing patterns across various food categories. In 2012–2014, beef contributed most to GHGE among all food categories. By 2017–2019, GHGE from beef products decreased by ~67%. Pork decreased by 47%, meat-other by 45%, lamb by 42%, poultry by 29%, and cheese by 17%. Milk, yoghurt, and cream were the second-largest contributors to GHGE in 2012–2014 and became the leading contributors in 2017–2019, overtaking beef. GHGE from milk, yoghurt, and cream decreased modestly by 2% over the period.
Shifts in food purchasing in ‘Champion’ households
The analysis of the average purchase volume per food products in ‘Champion’ households shows a growing preference for plant-based options from 2012 to 2019, which is reflected in the changing shares of food products in the total purchasing volume. Mean volume shares of food products for the periods 2012–2014 and 2017–2019, as well as the associated percentage changes, are presented in Fig. 2.

Mean change in the share of food products in household shopping volumes from 2012–2014 to 2017–2019 (percentage points). a shows food categories with increased volume shares, and (b) shows categories with decreased volume shares. Bold orange elements indicate food groups with the greatest increases or decreases in share. Data source: Kantar Worldpanel Take Home data (52 w/e Dec. 2012–2019).
The share of plant-based dairy alternatives increased the most, from 0.9% in 2012–2014 to 3.3% in 2017–2019. Similarly, the share of fruits in the purchasing volume increased, from 9.2% to 11.4%, while the share of vegetables increased from 11.4% to 12.9%. Milk, yoghurt, and cream, which already accounted for a high share of household purchases, increased from 18.3% to 19.7%. There was also an increase in plant-based meat alternatives, from 0.2% to 0.6%. Smaller increases were observed in legumes and pulses (+0.2 percentage points), edible ices and desserts (+0.2 ppt), snacks (+0.1 ppt), and nuts and seeds (+0.1 ppt).
Conversely, the share of several animal-sourced and other food categories has decreased on average. The most substantial reduction occurred in poultry, which dropped from 3.4% to 1.8%, followed by beef from 1.5% to 0.4%. Similarly, other meats decreased from 3.1% to 2.1%, while pork fell from 1.7% to 0.8%. Declines were also observed in spices, condiments, and sauces (−0.6 ppt), starchy vegetables (−0.4 ppt), sugars and sweeteners (−0.3 ppt), cereals (−0.3 ppt), lamb (−0.3 ppt), and cheese (−0.3 ppt).
Distinct changes in food purchasing patterns in ‘Champion’ households
Changes in purchasing patterns among ‘Champion’ households were grouped into two distinct clusters using Latent Class Analysis (LCA): ‘plant-based adopters’ (Cluster 1) and ‘meat to dairy’ (Cluster 2). The ‘plant-based adopters’ consisted of 277 households, while the ‘meat to dairy’ cluster included 432 households. While both clusters reduced their purchases of beef, poultry, pork, and other meats at similar rates, they differed substantially in their changes to other food categories (Fig. 3).

Mean changes in the share of food products in household shopping volumes from 2012–2014 to 2017–2019. a Shows results for the ‘plant-based adopters’, and (b) for the ‘meat to dairy’ cluster, both identified through latent class analysis (LCA). Bars represent mean changes in food category shares, coloured by category type: animal (blue), mixed (orange), and plant-based (green). Error bars indicate 95% confidence intervals. Data source: Kantar Worldpanel Take Home data (52 w/e Dec. 2012–2019).
Households in the ‘plant-based adopters’ cluster showed substantial increases in plant-based and healthier options. The largest rise was in vegetables (+4.0 ppt), followed by plant-based dairy alternatives (+3.9 ppt), fruits (+3.8 ppt), and plant-based meat alternatives (+0.9 ppt). Additional increases were observed in legumes and pulses (+0.5 ppt) and nuts and seeds (+0.2 ppt). Conversely, these households reduced the share of animal-based products, such as milk, yoghurt, and cream (−3.8 ppt), poultry (−2.1 ppt), other meats (−1.4 ppt), beef (−1.2 ppt), pork (−1.0 ppt), and lamb (−0.3 ppt).
Households in the ‘meat to dairy’ cluster demonstrated a different pattern of change, characterised by considerable increases in certain dairy products and reductions in various meats. The largest increase was in milk, yoghurt, and cream (+4.6 ppt), followed by fruits (+1.4 ppt). While increases in plant-based dairy alternatives, desserts, snacks, prepared foods, and bakery wares were observed in this cluster, there was high variability among households. Similar to the ‘plant-based adopters’, households in the ‘meat to dairy’ cluster substantially reduced their purchases of meat products, such as poultry (−1.5 ppt), beef (−1.3 ppt), other meats (−1.1 ppt), and pork (−0.9 ppt). Additional reductions occurred in starchy vegetables (–0.7 ppt), cheese (−0.4 ppt), lamb (−0.3 ppt), and fish (−0.3 ppt). Other observed changes in both clusters were less consistent due to high variability between households.
These changes in purchasing patterns resulted in similar relative reductions in GHGE across clusters. The ‘plant-based adopters’ reduced their GHGE by 35%, from 4.0 kg CO2e per day to 2.6 kg CO2e per day, while the ‘meat to dairy’ cluster achieved a 33% reduction, from 4.8 kg CO2e per day to 3.2 kg CO2e per day (Supplementary Fig. 1). Overall shopping volumes also declined, with the largest reduction observed in the ‘meat to dairy’ cluster (−9.0%), compared to smaller decreases in the ‘plant-based adopters’ (−1.3%) and the total sample (−3.1%) (Supplementary Fig. 2). Daily per capita kilocalorie (kcal) purchases also declined among ‘Champion’ households. The ‘plant-based adopters’ reduced their average energy purchases by 14.3%, from 1283 kcal per day to 1099 kcal per day, while the ‘meat to dairy’ cluster saw a reduction of 14.4%, from 1500 kcal per day to 1284 kcal per day. In comparison, households in the total sample decreased average energy purchases by 4.4%, from 1190 kcal per day to 1138 kcal per day (Supplementary Fig. 3).
Characteristics of ‘plant-based adopters’ and ‘meat to dairy’ households
The logistic regression analysis identified sociodemographic characteristics distinguishing the ‘plant-based adopters’ and ‘meat to dairy’ households from the total sample of all households in the dataset. This analysis highlights the unique traits of these clusters compared to the broader population (detailed significance levels are presented in Fig. 4).
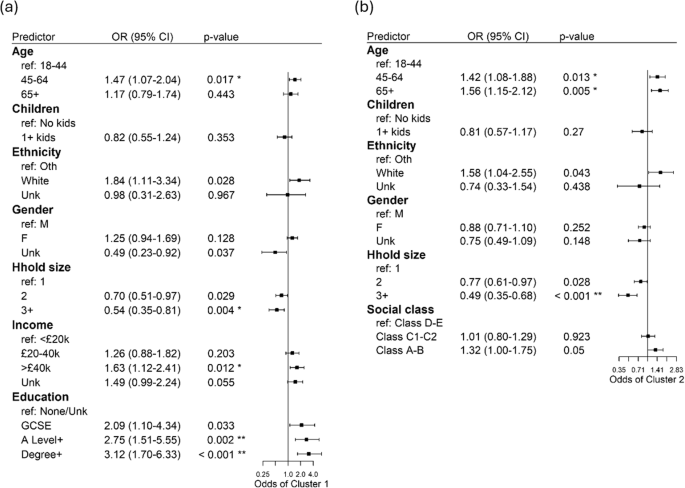
Comparison of sociodemographic characteristics of two clusters of household purchasing patterns, ‘plant-based adopters’ (a) and ‘meat to dairy’ clusters (b), relative to the total household sample. The odds ratios (OR) and 95% confidence intervals (CIs) from logistic regression analysis indicate the likelihood of belonging to each cluster compared to reference categories (marked as ‘ref’). Odds ratios greater than 1 indicate increased likelihood of belonging to the respective cluster, while ratios below 1 indicate reduced likelihood. Statistical significance levels are indicated as follows: (*) significant after false discovery rate (FDR) adjustment (p < 0.05); (**) significant after both FDR and Bonferroni adjustments (p < 0.05). Data source: Kantar Worldpanel Take Home data (52 w/e Dec. 2012–2019).
‘Plant-based adopters’ households were predominantly characterised by higher education levels, older age groups, smaller household size, and elevated income. Specifically, households with a degree were 3.1 times more likely to belong to the ‘plant-based adopters’ cluster compared to households with no educational qualifications (OR = 3.1, 95% CI: 1.7–6.3, p < 0.001). Similarly, households holding A level, higher education, or other qualifications had an increased likelihood of membership (OR = 2.8, 95% CI: 1.5–5.5, p = 0.002), as did those with GCSE qualifications (UK secondary school qualifications, typically at age 16) (OR = 2.1, 95% CI: 1.1–4.3, p = 0.033). Age was another significant factor; households headed by individuals aged 45–64 were 1.5 times more likely to belong to the ‘plant-based adopters’ cluster compared to those aged 18–44 (OR = 1.5, 95% CI: 1.1–2.0, p = 0.017). Household size inversely influenced membership, with households comprising three or more members being 47% less likely to belong to the ‘plant-based adopters’ cluster compared to single-member households (OR = 0.5, 95% CI: 0.4–0.8, p = 0.004). Households with two members also showed a reduced likelihood of affiliation compared to single-member households (OR = 0.7, 95% CI: 0.5–1.0, p = 0.029). Higher income levels were positively associated, as households in the highest income bracket (earning over £39,999 per annum) were 1.6 times more likely to belong to the ‘plant-based adopters’ cluster compared to those earning less than £20,000 per annum (OR = 1.6, 95% CI: 1.1–2.4, p = 0.012). Additionally, households identifying as white were 1.8 times more likely to be in the ‘plant-based adopters’ cluster compared to households of other ethnicities (OR = 1.9, 95% CI: 1.1–3.3, p = 0.028), though this was a weak association that did not remain significant after stricter p value criteria.
‘Meat to dairy’ households were primarily distinguished by older age and smaller household size. Households headed by individuals aged 65 and above were 1.6 times more likely to belong to the ‘meat to dairy’ cluster compared to those aged 18–44 (OR = 1.6, 95% CI: 1.2–2.1, p = 0.005). Similarly, households headed by individuals aged 45–64 were 1.4 times more likely to belong to the ‘meat to dairy’ cluster compared to the 18–44 age group (OR = 1.4, 95% CI: 1.0–1.9, p = 0.013). Household size was also a significant predictor; households with three or more members were 51% less likely to belong to the ‘meat to dairy’ cluster compared to single-member households (OR = 0.5, 95% CI: 0.4–0.7, p < 0.001), and two-member households were 23% less likely to be part of the cluster compared to single-member households (OR = 0.8, 95% CI: 0.6–1.0, p = 0.028). Additionally, households identifying as white were 1.6 times more likely to belong to the ‘meat to dairy’ cluster compared to households of other ethnicities (OR = 1.6, 95% CI: 1.0–2.6, p = 0.043), but this association did not meet stricter p-value thresholds after corrections. Social class was marginally associated with membership, with higher social classes (Class A–B) being 1.3 times more likely than skilled working class and lower (Class D–E) to belong to the cluster (OR = 1.3, 95% CI: 1.0–1.8, p = 0.050), but this also did not hold under stricter p-value criteria.
For both clusters, the presence of children interacted with household size. When household size was excluded from the models, having children significantly reduced the likelihood of belonging to both the ‘plant-based adopters’ and ‘meat to dairy’ clusters.
Source link
Flipping the Pyramid: Public Perceptions of New Dietary Guidelines
Portuguese eating habits have consequences for health
AIIMS-trained doctor shares secret to 13 kg weight loss ‘without extreme diet using this 1 nutrient’: It is not protein